Emergency service vehicles such as Fire & Rescue and Ambulances need to respond to traffic accidents, fires and other life threatening incidents very rapidly and as such need a clear road ahead of them to arrive as quickly and as safely as possible.
Roads are becoming far more congested with the increase in the number of road users making journey times much longer.
Environmental conditions such as rain, fog, snow, heavy rain or road spray and also the hours of darkness can severely restrict the clear view of emergency service vehicles to the driver.
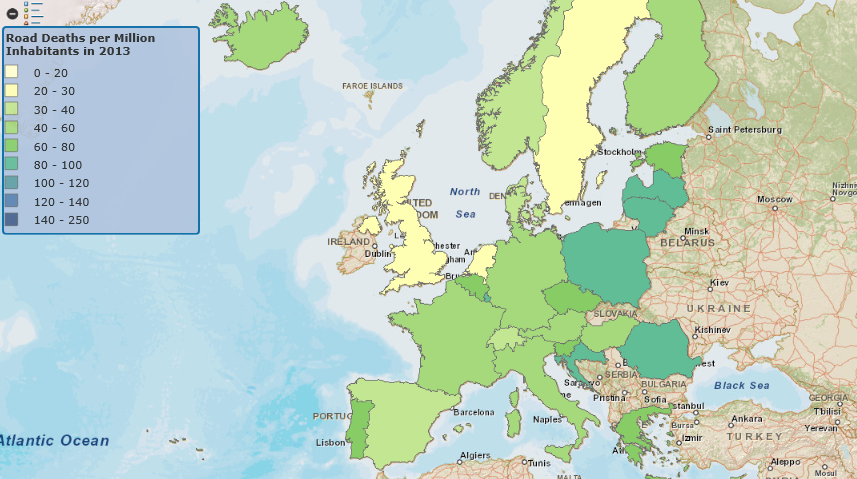
EU Accident Statistics Map:
The geographical representation of fatality rates showing road deaths per million inhabitants in 2013.
In 2013 road traffic accidents in the European Union claim about 26,000 lives and leave more than 1.3 million people.
The Commission has adopted an ambitious Road Safety Programme which aims to cut road deaths in Europe between 2011 to 2020.
The programme sets out a mix of initiatives, at European and national level on improving:
1. Vehicle safety
2. The safety of infrastructure
3. Road users' behaviour
© European Union, 1995 - 2015 Source, CARE (EU road accidents database) or national publications
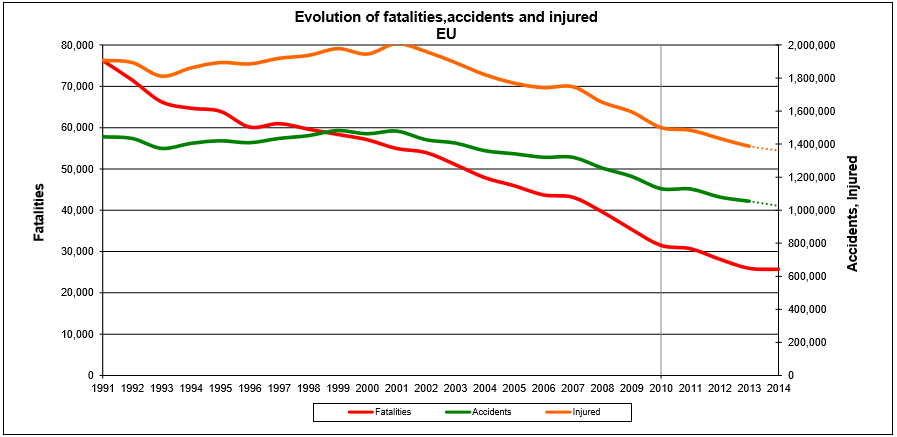
EU Accident Statistics:
The chart shows the relative change in road fatality numbers in the EU over the decade.
Although the fatality numbers are improving in 2011, more than 30,000 people died on the roads of the European Union, i.e. the equivalent of a medium town.
For every death on Europe's roads there are an estimated 4 permanently disabling injuries.
© European Union, 1995 - 2015 Source, CARE (EU road accidents database) or national publications
Fire & Rescue Response Statistics UK:
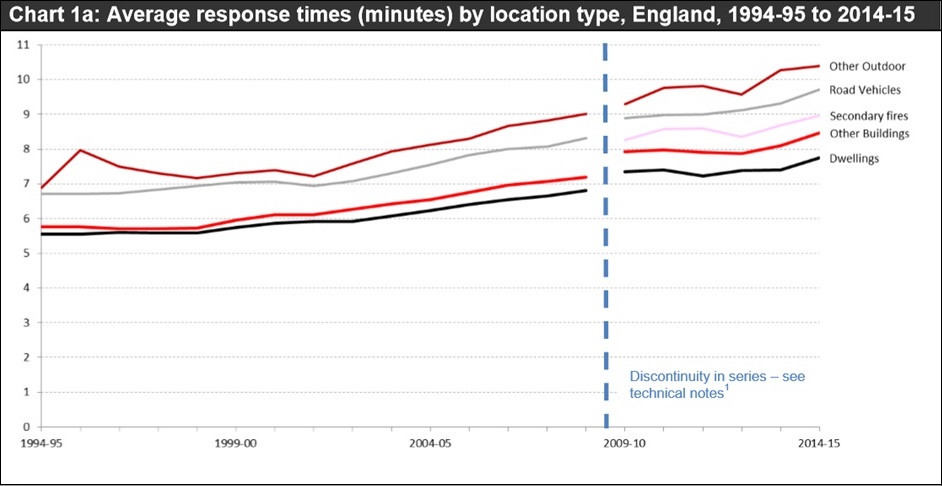
Chart 1a shows an example for England where Emergency Fire Services that the average response times to fires in all types of location have been steadily increasing over the last 20 years:
The average response times for Emergency Fire Services to arrive at “All Primary Fires” has increased from 6.1 to 8.7 minutes:
- an increase in arrival time of 32.6%
The average response time for Emergency Fire Services to arrive at “Road Vehicles” has increased from 6.7 to 9.7 minutes:
- an increase in arrival time of 44.7%
Chart 1a © Crown copyright, 2015 Source: Fire & Rescue Statistical Release 19/11/15
Chart 1a also shows the Emergency Fire Services that for road vehicle fires and other outdoor primary fires have the slowest response time with the average response time during 2014-15 to road vehicle fires was 9 minutes 42 seconds:
- an increase of 49 seconds over the last five years
Ambulance Response Statistics UK:
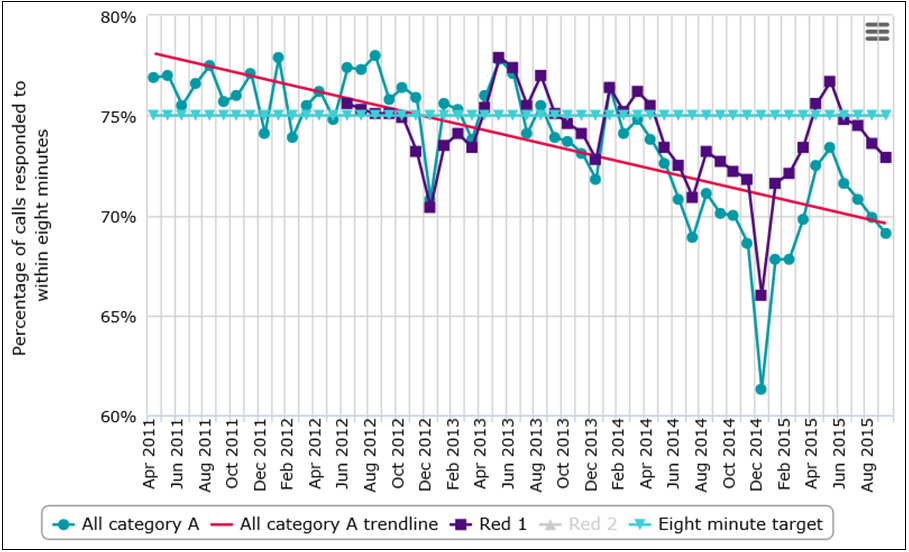
The England Department of Health requires that the ambulance service reaches 75% of category A (life-threatening) calls within 8 minutes.
If onward transport is required a (suitable vehicle) should arrive on the scene within 19 minutes.
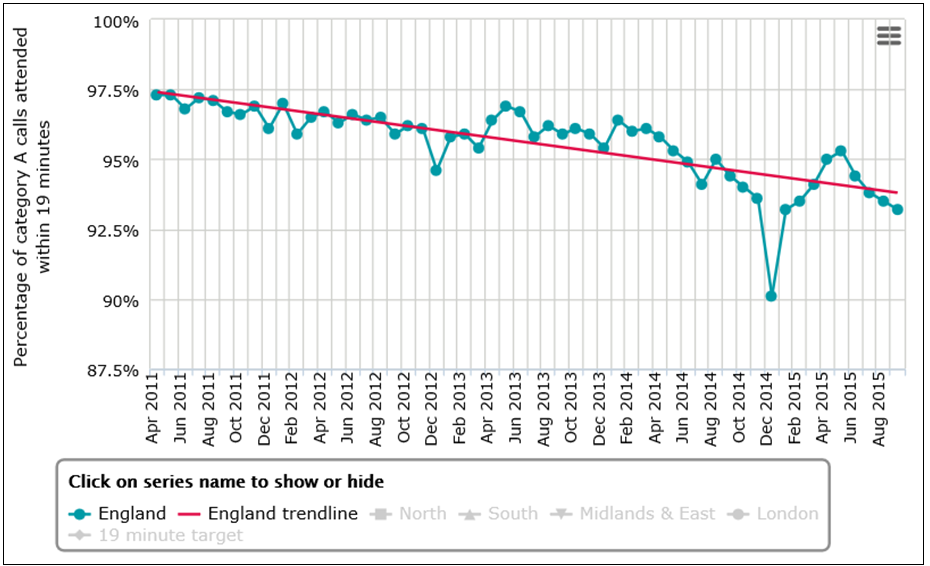
Chart 2a shows for England that there has been a steady decline in the number of Category A calls attended within 8 minutes over the past 4 years.
- 8 minute 75% target not met
The national target of reaching 75% of Category A calls within eight minutes has been breached in 20 consecutive months.
Chart 2a © Crown copyright, 2015 Source: NHS England, Ambulance Quality Indicators
The England Department of Health require
that when onward patient transport is required in a life threatening situation an ambulance should arrive on scene within 19 minutes.
Chart 2a shows as with the 8 minute target, there has been a steady decline over the past 4 years in the proportion of Category A calls with an ambulance on scene by 19 minutes.
- 19 minute 75% target not met
There has been deterioration in performance across all regions since March 2014 and performance remains below the target.
Since June 2015 no regions has managed to reach the target.
Chart 3a © Crown copyright, 2015 Source: NHS England, Ambulance Quality Indicators
Police Response Statistics:
In England each Police force can set its own targets for how long it should take them to respond to 999 emergencies.
According to statistics from the House of Commons library from 27 forces surveyed the response time between 2011 to 2014 have increased as follows.
Average response times:
- Average response time increased 17%
Night time response times between 11pm and 6am for the highest priority 999 calls:
- Increased in 20 of 27 police areas
The time it takes for police to respond to the most serious night-time emergencies:
- Increased by up to 57%
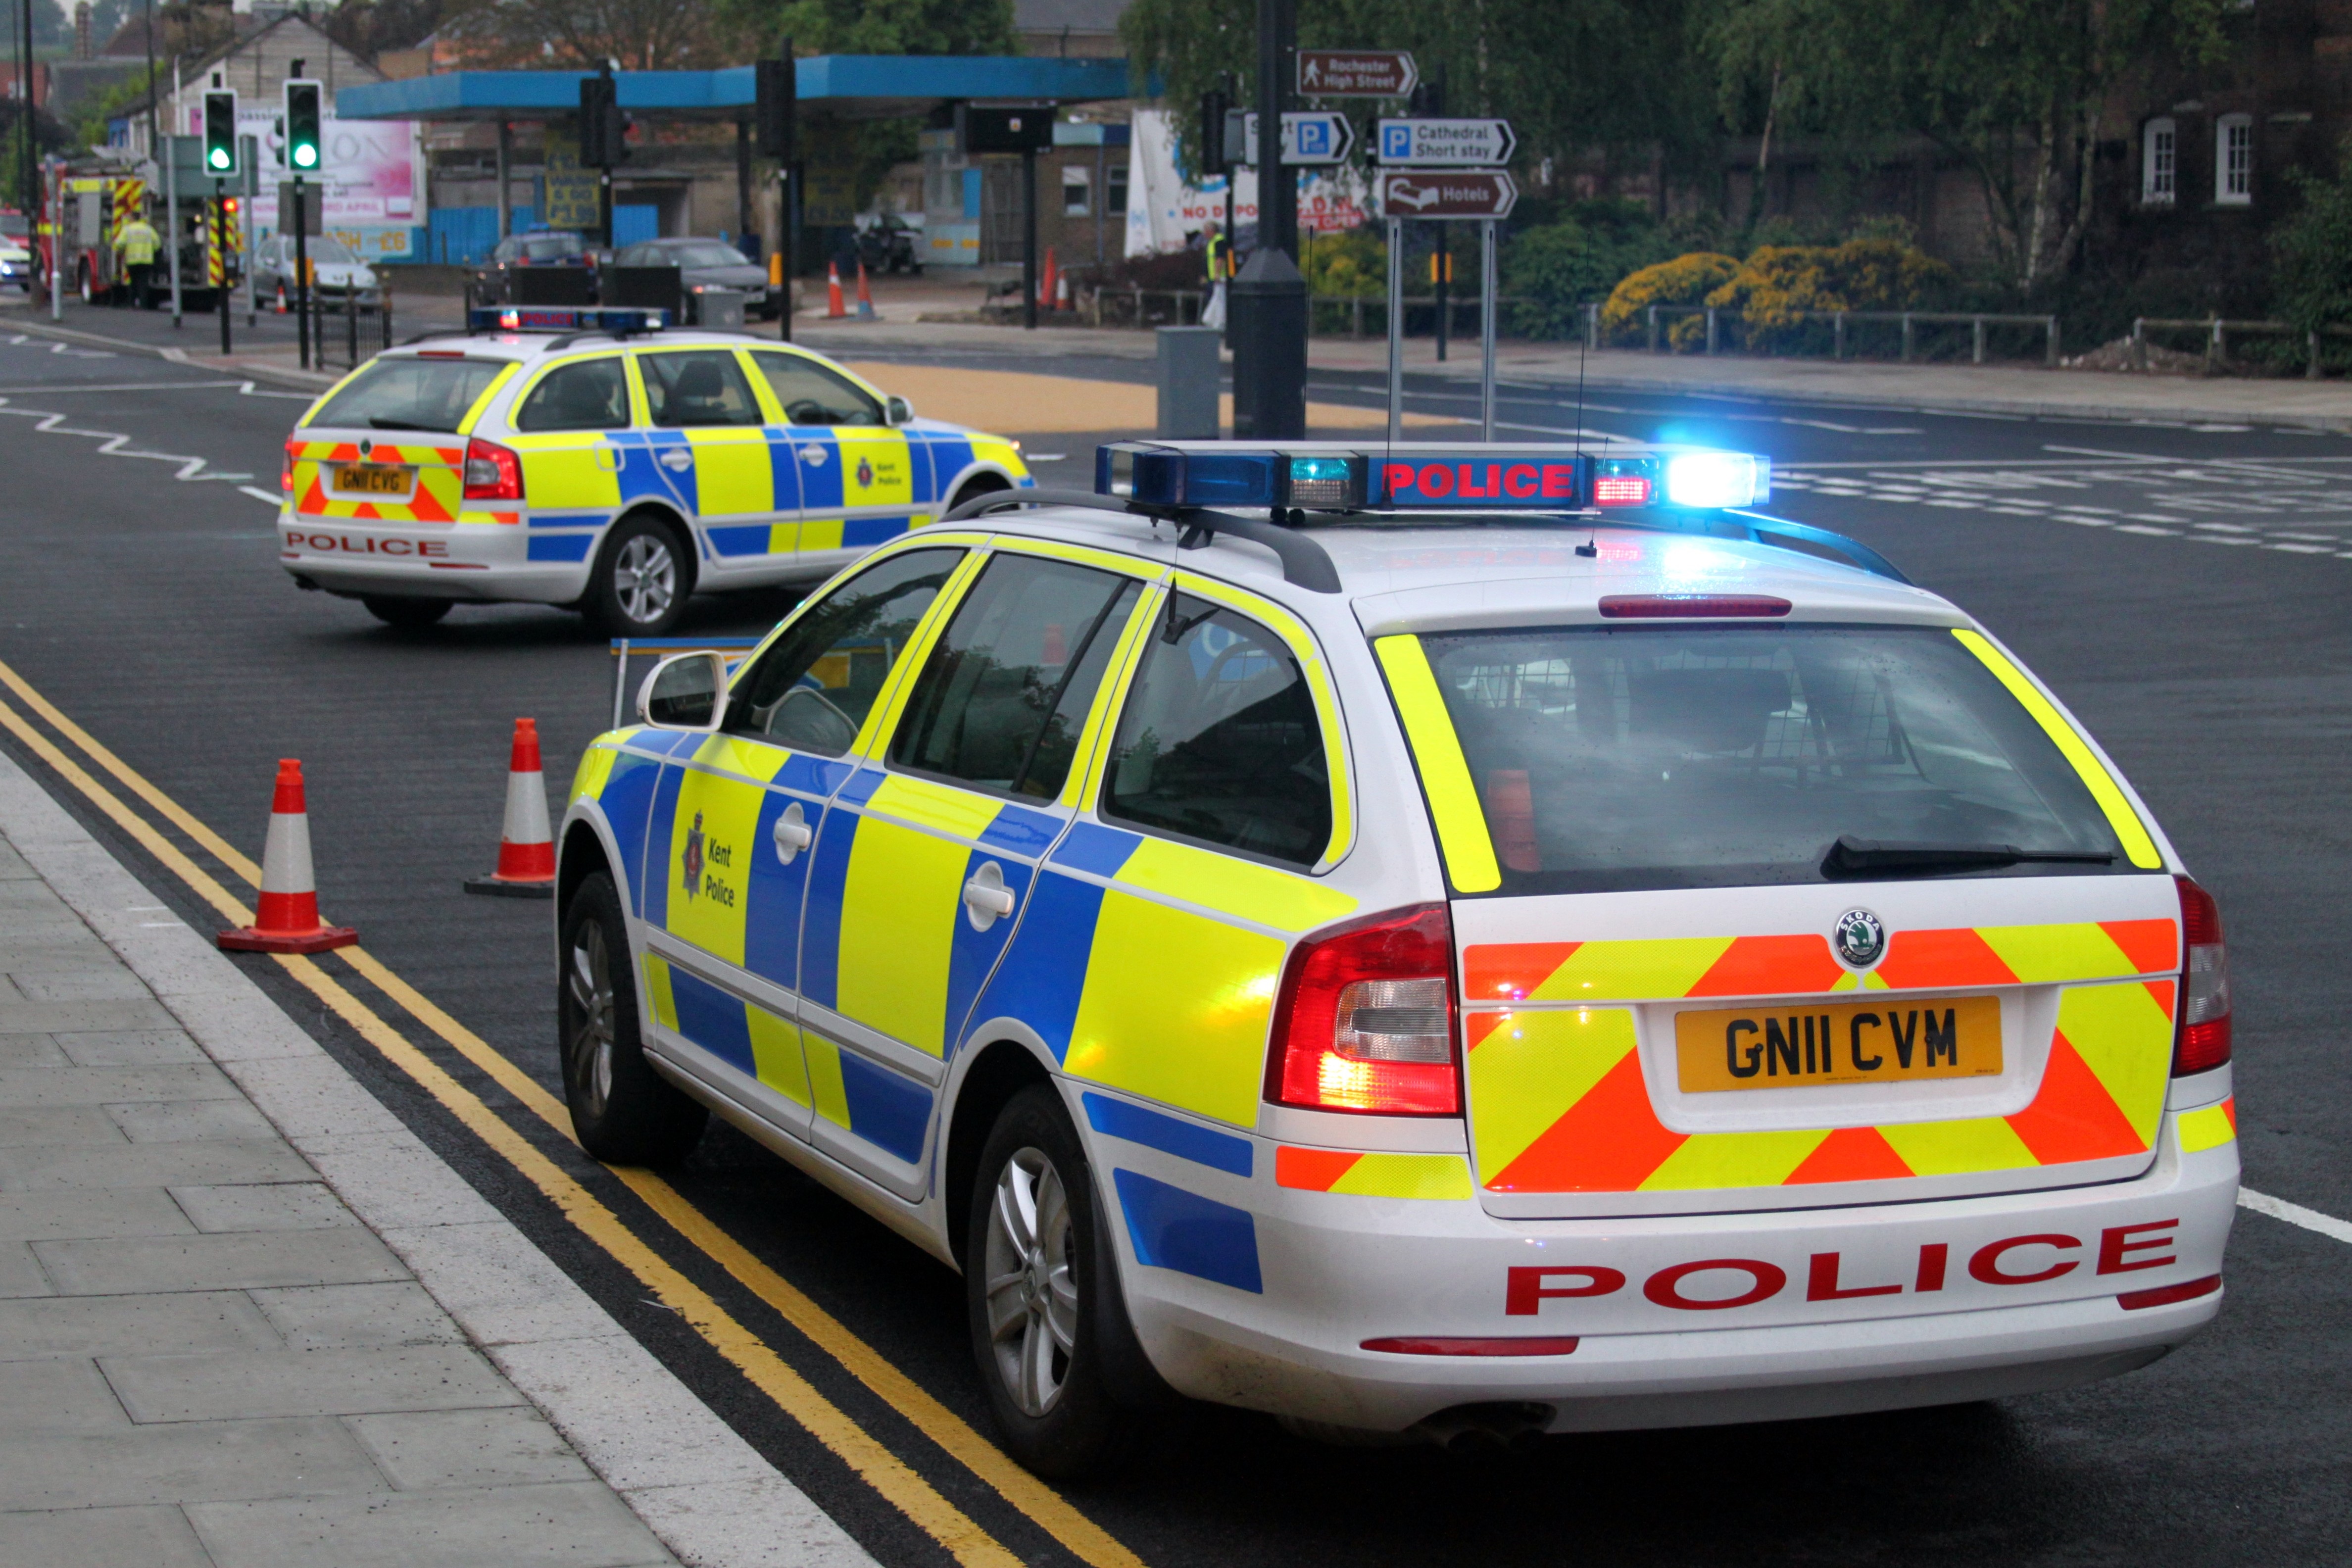
Image: Creative Commons CC0 :www.flickr.com/photos/jf01350/5694915773/i...
Traffic Growth Statistics:
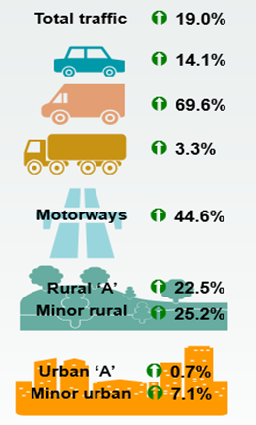
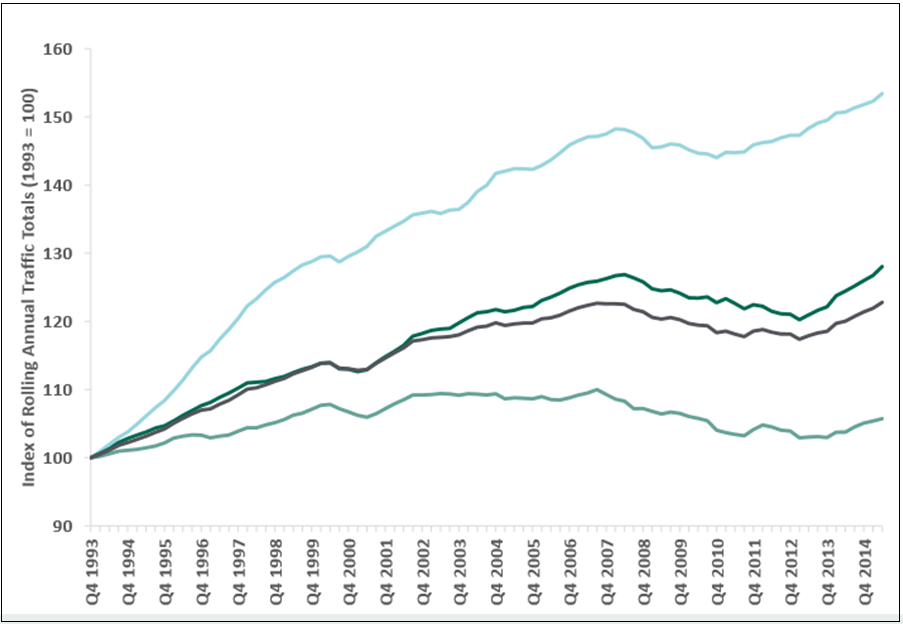
Traffic across all vehicle types and road classes has increased. Motor vehicle traffic in Great Britain increased by 2.3% in the year ending June 2015 from the previous year. The provisional figure of 314.6 billion vehicle miles is the highest rolling annual total ever recorded.
Traffic trends over the last 20 years
Rolling annual index of road traffic in Great Britain by road type
Chart 4a and 5a © Crown copyright, 2015 Source: Department for Transport

